Bikes Company Sales Analytics using SQL and Power BI
In this project, I have to build a dashboard to meet the demand from the sales manager in a Bikes Company
Project Summary
Click here to access full of my project on my Github- Input: This is a dataset from Microsoft which is about Internet Sales. It includes dimension and fact tables about sales, customers, products and transactions from 2019 to 2021. It can be download here
- Goal:
- Analyze the business performance on overview customer and revenue
- Propose suggestions to improve the business performance
- Result:
- Problems: why business stopped selling Bikes category while its revenue increased everyer from 2019-2020?
- Insights:
- Businesses operate effectively when revenue increases and budget decreases over the years.
- The main market is in English-spoken countries like: the US, Europe and Australia.
- Customers are most distributed in London and Paris.
- Equal number of male and female customers.
- The best-selling model is the Mountain-200, especially around the end of the year. - Suggestions:
- Promote promotional activities on holidays of these countries such as Christmas, Thanksgiving or New Year.
- Promote the promotion of the Mountain-200 model at the end of the year.
- Project Duration
- Identify business requirements and create user story based on an “email” from the sales manager
- Extract and clean data using SQL
- Building dashboard
- Conclusion
- Suggestions
- Business requirements and user story creating
Assume that this is an email from a sales manager:
I hope you are doing well. We need to improve our internet sales reports and want to move from static reports to visual dashboards. Essentially, we want to focus on how much we have sold of what products, to which clients and how it has been over time. Seeing as each sales person works on different products and customers it would be beneficial to be able to filter them also. We measure our numbers against budget so I added that in a spreadsheet so we can compare our value against performance. The budget is for 2021 and we usually look 2 years back in time when we do analysis of sales.
Then I create a user story as below:No # As a (role) I want (request/demand) So that I (user value) Acceptance Criteria 1 Sales manager to get a dashboard overview of internet sales can follow better which customers and products sells the best a power bi dashboard which updates data once a day 2 Sales representatives a detailed overview of internet sales per customers can follow up my customers that buy the most and who we can sell to a power bi dashboard which allows me to filter data for each customer 3 Sales representatives a detailed overview of internet sales per product can follow up my product that buy the most and who we can sell to a power bi dashboard which allows me to filter data for each product 4 Sales manager a dashboard overview of internet sales follow sales over time against budget a power bi dashboard with graphs and KPIs comparing against budget - Data cleaning and extraction using SQL
I use SQL to extract some necessary tables and columns from the data warehouse. You can see the way I extract data from the data warehouse in the .sql script here
I extract fours dimension from the data warehouse:
Dimention 1: DIM_CALENDARDimention 2: DIM_CUSTOMERS Dimention 1: DIM_SALES
 Dimention 1: DIM_PRODUCTS

- Building a dashboard using Power BI
I import all dimensions in Power BI and create relationships for them.
I use Power BI to build a dynamic dashboard about sales overview, customers and product.The overview dashboard shows that: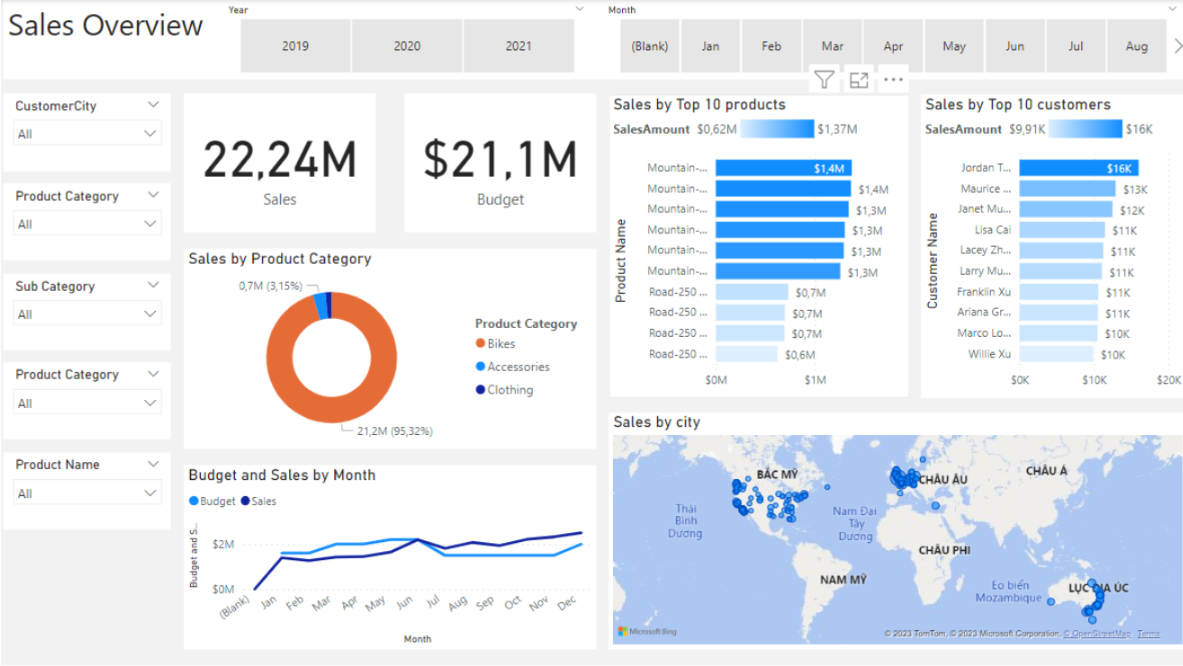
- Revenue grew and budget declined over the years which means that business operated efficiently.
- The main product is Bikes which accounted for the majority of sales in 2019 and 2020 but are no longer sold in 2021. Why is that?
- The main market is in English-spoken countries like: the US, Europe and Australia. Therefore, the business should promote promotional activities on holidays of these countries such as Christmas, Thanksgiving or New Year.The customer dashboard shows that:
- Customers are most distributed in London and Paris
- Equal number of male and female customers - Conclusion
- Problems: why business stopped selling Bikes category while its revenue increased everyer from 2019-2020?
- Insights:
- Businesses operate effectively when revenue increases and budget decreases over the years.
- The main market is in English-spoken countries like: the US, Europe and Australia.
- Customers are most distributed in London and Paris.
- Equal number of male and female customers.
- The best-selling model is the Mountain-200, especially around the end of the year.
- Suggestions
- Promote promotional activities on holidays of these countries such as Christmas, Thanksgiving or New Year.
- Promote the promotion of the Mountain-200 model at the end of the year.
Here the full code and dataset I used
Click here